It's changing the way we do business in the media industry, from the way we inform ourselves on a daily basis, to the large decisions that turn the cogs at the macro level. Intelligent, forward-thinking business leaders no longer make decisions unless they've crunched the numbers and deliberated over the data available to them.
While the sheer volume of numbers can be confusing and frustrating, data has become a significant part of everyday life for many people, including those working in media and marketing. So what is data? The generally accepted definition is "information in a raw or unorganised form", while "information" is simply data that has been refined for decision making. Information is useful whereas unfiltered, unprocessed data is not genuinely informative. One man's trash is another man's treasure when it comes to the term "data" and the phrase "beauty is in the eye of the beholder" is therefore quite fitting.
I'm guessing there's a 99% chance that you've heard of the term "Big Data". The easiest way to illustrate what it is would be to provide a human example. From the beginning of recorded time up until 2003, humans collected 5 Exabytes (5 billion gigabytes) of data. In 2010, the same amount was being collected every two days, which makes 'big data' sound like an incredible understatement.
South Africans are participating in the field, too. We collect vast amounts of data from ads, e-commerce sites, surveys and user-generated content like blogging and social updates. While the capture, storage, analysis and visualisation of such large data sets are extremely complicated, it's good news for media and marketing in SA. Not only does it give brands and advertisers more information to work with and create value, it establishes a foundation for growth and competition between businesses and that is good for economic activity on a broader scale.
For business to go on as usual, data is used in three main ways:
• It quite simply shows us the obvious. Total Impressions served, total clicks, number of sales, etc. Downloading a data set from an engine like Adwords or the interface of a demand side platform gives us an easy look at the tabular data (text, numbers, dates, etc). This is the first step of an analysis process that will shape our thinking and inform the actions that follow.• Secondly, we use data to understand the audience. Once you have the totals in front of you, the next step is to understand the "who" of the data. This can be a geographic location, a gender or age demographic or even a unique culture. In media and marketing it's important to know who you're dealing with in order to deliver a high standard of relevancy.
• You also need to inform yourself on behaviour. You've measured the numbers and you've had a look at the audience - your next commitment is to recognise the specific engagement wants and needs of your crowd. How do they use the web? Which of your ads do they interact with? When do they prefer to trade? These are just some of the intricate questions.
With the rise of programmatic display advertising and its working relationship with the creatives who build rich media units, there are many opportunities for young people who want to work with data in the media industry, either from an analytical or creative point of view. Building data into visualisations enables better trend and pattern discernment and unifies the data for decision making. Having said that, one needs to be careful for two main reasons - sometimes the visualisation is incorrect, and sometimes the data is intentionally misrepresented.
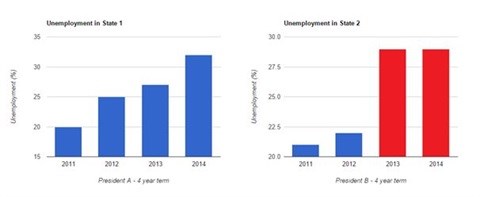
The presentation of accurate data has the power to influence decision making, however the same goes for inaccurate data! See below an example of intentionally misleading data in the form of two charts:
The charts show unemployment figures (in percentages) from 2011 to 2014 in two states, both with their own leaders. Such charts are often used in news bulletins, where viewers are shown data sets quickly and not given time to examine them. At a glance, the data seems to favour President A for keeping unemployment in check (in State 1).
The facts
• The Y axes are not identical - State 1 starts on 15% and goes up to 35% (the range is twice that of State B).• The colour red is used to indicate how unemployment shot up during President B's term. While that is the case, unemployment went up by seven percentage points between 2012 and 2014 in both states (25% - 32% in State A; 22% - 29% in State B).
• On further investigation President B has not been given due credit. For one, joblessness in his state is lower than in his counterparts. Secondly he's kept unemployment steady in 2014, whereas in State A it continued to climb.
• The last point is fairly obvious but these charts do not take exogenous circumstances into account. Factors such as macroeconomics, population expansion and global financial crises can all affect the rate of employment.
What does all this mean? It means that data always has a story to tell, but the numbers can be manipulated visually to pursue an agenda. When analysing data, we must always take the time to consider everything that could affect the numbers - that way we won't miss the bigger picture.
Data may look scary at first but understanding how to navigate it is what makes it exciting to work with. To really view data from the outside is to have the confidence to break it up into a granular level and see what information you can squeeze out of it. Explaining the many uses of data would be difficult to do in a single article. Frederick Mosteller once said that while it is easy to lie with statistics, it is easier to lie without them. Having data is essential when you need to be able to support the rationale for having your argument heard.
In conclusion, the industry is increasingly influenced by data and being at Mark 1 has given my team an ideal platform from which to work with it. Analysis of data empowers the ad operations team with information, which they use in optimising campaigns to full potential. Behind the scenes, an overwhelming amount of data can easily fill an ocean but if we approach it logically, we shouldn't be afraid to dive in.
More on data
• Who owns data? Without getting into the intricate legal tangle that regulates data collection and management, it is owned by a 1st party that captures it in a legitimate fashion and has a direct relationship with the customer. The 1st party will often sell the data down the line to a 3rd party; a buyer or corporate partner. The data is then commonly exploited for other purposes including remarketing.• How is it captured? Most companies that collect big data make use of a Data Management Platform to capture, identify and segment data in order to generate value and tailor target offers to segmented audience groups.
• It's clear that building databases is paramount to any online business, where captured information is used to retarget web users for marketing purposes. Companies do this with good reason - according to Hubspot, 99 percent of first-time visitors to e-commerce sites don't complete their purchases. With this in mind, re-targeting is crucial to an e-commerce business's returns.
• When capturing data, know the questions that you want to answer but don't have preconceived notions of what you want the answers to be. If you do, you may capture or represent the data with an observer bias, whereas the best analysts are able to look at data subjectively.